

MarkeTrak 2025 Examines Hearing Devices, OTC Adoption, and Consumer Experience
Market research, Hearing Review, July/August 2025. By Bridget Sobek Dobyan, JD, and Thomas A. Powers, PhD.
MarkeTrak 2025 (MT2025), the twelfth edition of the study, extends MarkeTrak 2022 (MT2022) with a nationally representative series of consumer questions. It keeps core questions for comparisons over time and adds data about prescription hearing aids, over-the-counter (OTC) devices, implants, and emerging products such as earbuds with hearing-enhancement features.
The Hearing Industries Association (HIA) has commissioned MarkeTrak since 1989 to study the US market among people reporting hearing difficulties. It estimates the prevalence of self-reported difficulty and adoption of hearing aids, cochlear implants, and other devices, while examining demographics, decisions, and attitudes. The following are the authors' selected MT2025 findings and comparisons; they are survey estimates, not clinical diagnoses.
01. Hearing difficulty
MT2025 used an online method closely aligned with MT2022, MT10 (2019), and MT9 (2015). Az Marketing Research Inc. conducted the survey in October and November 2024. It covered 16,148 US households, balanced and weighted to key US Census characteristics (Figure 1). Within those households, 42,982 people completed the first part used to estimate rates. A second part about the hearing-health journey included 2,955 people who reported hearing difficulty: 1,173 hearing-aid owners and 1,782 nonowners.
Figure 1. Survey population and weighting.
The MT2025 estimate of self-reported hearing difficulty was 9.1%, compared with 10–11% in earlier MarkeTrak studies since 1989. Figure 2 shows the reported rate rising steadily up to age 55 and more sharply thereafter. Relative to MT2022, it fell from 34.1% to 32% for ages 75–84, and from 55.7% to 54% for ages 85 and older. For ages 25–34 it fell from 6.5% to 5%, and for ages 35–44 from 7.5% to 6%. The authors say the overall decline warrants further study.
Figure 2. Self-reported hearing difficulty by age.
Among people reporting hearing difficulty, 73% reported difficulty in both ears, compared with 70% in MT2022 and 72% in MT2019. By sex, the reported rate remained higher for men (12%) than women (7%). As in MT2022, Black, Indigenous, and other people of color (BIPOC) reported relatively lower rates than people identifying only as White, while rates within the BIPOC grouping were relatively consistent (Figure 3).
Figure 3. Self-reported difficulty by race. Respondents could select more than one race. “White” here means no other race was selected, sometimes called White only. The BIPOC group includes respondents identifying as Black, Native American, Asian, or Hispanic/Latino, either alone or together with White.
Professional hearing testing within the past year rose two percentage points, from 37% in MT2022 to 39% in MT2025. Among respondents with hearing difficulty who screened their own hearing, use of online tools fell from 16% to 9%, while smartphone or tablet app use fell from 13% to 9%.
MT2025 broadened device categories to include traditional prescription aids, OTC aids, implants, and hearing-enhancing earbuds. Roughly four in ten respondents reported owning a hearing aid, whether traditional, OTC, or another type. Including implant users raised total adoption to 43.4%. Among people reporting hearing difficulty, 51.3% owned some kind of hearing device—an aid, implant, or hearing-enhancing earbud. Among hearing-aid owners with bilateral hearing loss, 83% used a bilateral solution, 12 percentage points higher than MT2022.
Among people reporting hearing difficulty, 51% had discussed it with a primary-care doctor, down from 52% in MT2022. The share receiving a hearing-aid recommendation rose from 18% to 22%. Sixty percent had spoken with a hearing-care professional about their loss.
02. Hearing-aid owners
Time before taking action
As in MT2022, respondents took about four years on average from first noticing hearing difficulty to obtaining a hearing aid (Figure 4). The time to discuss it with a general practitioner, receive a professional hearing test, and first visit a hearing-care professional each shortened from four years to three.
Figure 4. Time between recognizing hearing difficulty and taking steps toward care.
First-time buyers
First-time purchasing is a key MarkeTrak measure and especially relevant after OTC aids entered the market. MT2015 and MT2019 found nearly 60% of purchasers across traditional, OTC, and other aid categories were first-time buyers. The share fell to 51% in MT2022, then rose to 60% in MT2025. Among MT2025 owners, 58% of traditional-aid users and 70% of OTC-aid users were first-time buyers.
OTC hearing aids are designated for adults who perceive mild to moderate hearing loss. In MT2025, 80% of OTC owners reported their loss as mild to moderate. The authors found differences in daily use: traditional-aid owners wore their devices an average 9.4 hours per day, versus 6.8 hours for OTC owners. OTC users also tended to be younger, employed, and in BIPOC groups. The authors suggest some could later move to prescription aids as hearing needs or experience change.
Device features
Owners increasingly recognized features such as volume control and rechargeability. Asked which functions their current aids had (Table 1), 74% reported volume control, up from 72%, and 69% reported rechargeability, up from 52%. Recognition declined for program buttons, microphones for noisy settings, and telecoils.
Table 1. Features reported by owners who bought hearing aids in the previous five years.
Wireless features increased from 63% in MT2022 to 70% in MT2025. This combined direct audio streaming from a smartphone, connected volume or program control, and streaming via accessories. The share with a downloadable app rose 10 percentage points since MT2022 to 54% in MT2025. The four features owners rated as most influential were volume control, rechargeability, a downloadable app, and smartphone audio streaming.
Device satisfaction
As in earlier MarkeTrak surveys, about eight in ten hearing-aid owners said they were satisfied with their devices. Traditional-aid owners were more likely than OTC owners to say they were “very satisfied.” The authors link this difference to greater satisfaction among owners who received help from a hearing-care professional, compared with those who did not.
Role of hearing-care professionals
Satisfaction with hearing-care professionals (HCPs) remained high: 90% of aid owners said they were satisfied with their HCP, slightly below 91% in MT2022 (Figure 5). Respondents valued professional advice, service and support, and help fitting, adjusting, and programming technology. Among nonowners, HCP satisfaction remained 73%, unchanged from MT2022.
Figure 5. Satisfaction with hearing-care professionals.
03. People who do not own hearing aids
Reasons for not buying
Despite higher overall adoption, some people reporting hearing difficulty had not sought care or used an aid. Among nonowners who had been advised to obtain one, the leading reasons in the 2025 survey were high price, inadequate insurance coverage, and not feeling ready. Among all nonowners without a current hearing aid, 15% said they would never buy one.
04. Conclusion
As the first MarkeTrak survey after the final US OTC hearing-aid rule, MT2025 shows both continuity and market change. The authors highlight cost, choice, features, and effects on health and participation as factors in people's decisions. They argue that high device satisfaction underscores technological value and that hearing-care professionals remain important in supporting users.
The article says further MT2025 analyses from academic authors and researchers were planned for the November 2025 issue of Seminars in Hearing. HIA says it intends to continue the MarkeTrak series as a resource on consumer behavior and market trends.
About the authors
Bridget Sobek Dobyan, JD, is executive director of HIA, where she leads strategy and advocacy. Her background includes nonprofit leadership, government affairs, and legislative policy work at federal and state levels. She earned a law degree from Michigan State University College of Law and belongs to the Michigan and District of Columbia bars.
Thomas A. Powers, PhD, is founder and managing partner of Powers Consulting LLC, which advises the hearing-health industry. After beginning his career as a partner in a private audiology practice, he spent more than 35 years in the hearing-aid industry. He earned a bachelor's degree at SUNY Geneseo and master's and doctoral degrees in audiology and hearing science at Ohio University. He is a licensed audiologist in New Jersey.
Image credit in the original article: online image, with no specific creator identified. Original Hearing Review article.
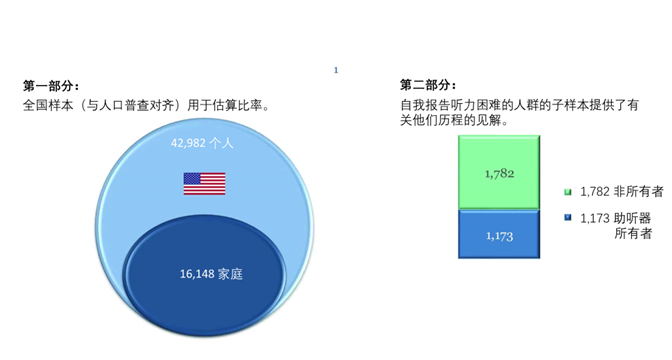
Part 1: A national sample aligned with the US census was used to estimate rates: 42,982 individuals in 16,148 households. Part 2: A subset of respondents who reported hearing difficulty provided information about their experiences: 1,782 non-owners (green) and 1,173 hearing-aid owners (blue).
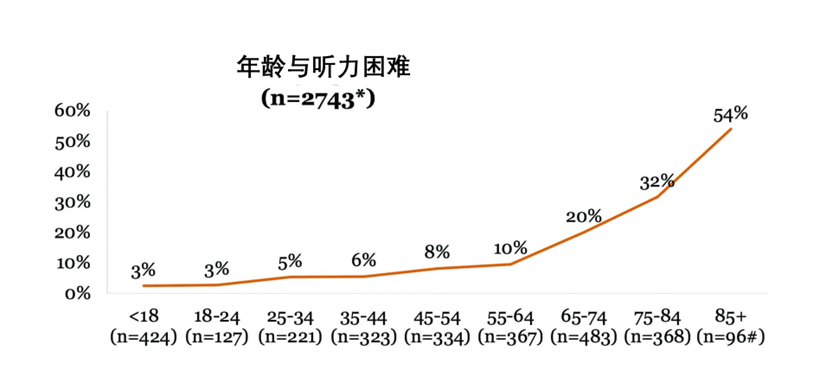
The horizontal axis shows age groups; the vertical scale is 0–60%, in 10-percentage-point steps. The title gives n = 2,743*, with the asterisk reproduced as in the image.
Under 18: 3% (n = 424); 18–24: 3% (n = 127); 25–34: 5% (n = 221); 35–44: 6% (n = 323); 45–54: 8% (n = 334); 55–64: 10% (n = 367); 65–74: 20% (n = 483); 75–84: 32% (n = 368); 85 and older: 54% (n = 96#). The image does not display explanations for the * and # markers.
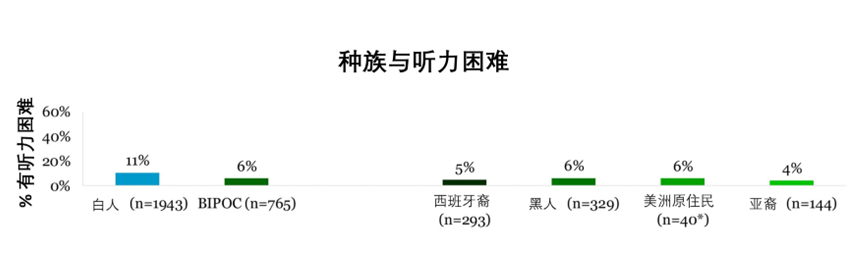
Vertical axis: percentage reporting hearing difficulty, from 0% to 60% in 20-percentage-point steps. Horizontal categories: White, BIPOC, Hispanic, Black, Native American and Asian.
White: 11% (n = 1,943); BIPOC: 6% (n = 765); Hispanic: 5% (n = 293); Black: 6% (n = 329); Native American: 6% (n = 40*); Asian: 4% (n = 144). The source image shows an asterisk after 40 but does not include its explanation. These are survey reports, not individual clinical diagnoses.

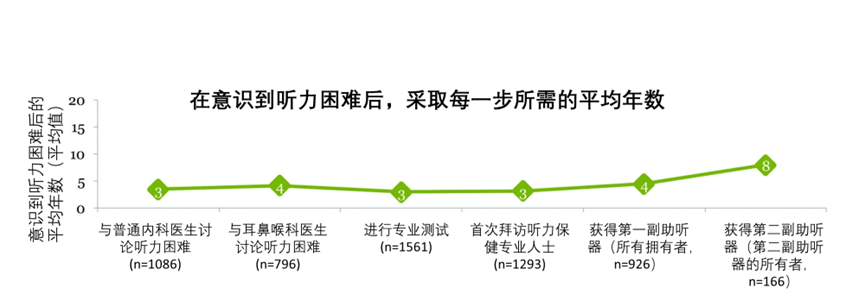
Vertical axis: mean years since becoming aware of hearing difficulty, shown from 0 to 20 in five-year steps. Horizontal axis: each action taken. The green line connects the six reported averages; these are not additional waiting periods to be added together.
Discussion with a general medical doctor: 3 years (n = 1,086). Discussion with an ear, nose and throat specialist: 4 years (n = 796). Professional hearing test: 3 years (n = 1,561). First visit to a hearing-care professional: 3 years (n = 1,293). First hearing aid, among all owners: 4 years (n = 926). Second hearing aid, among owners of a second device: 8 years (n = 166).
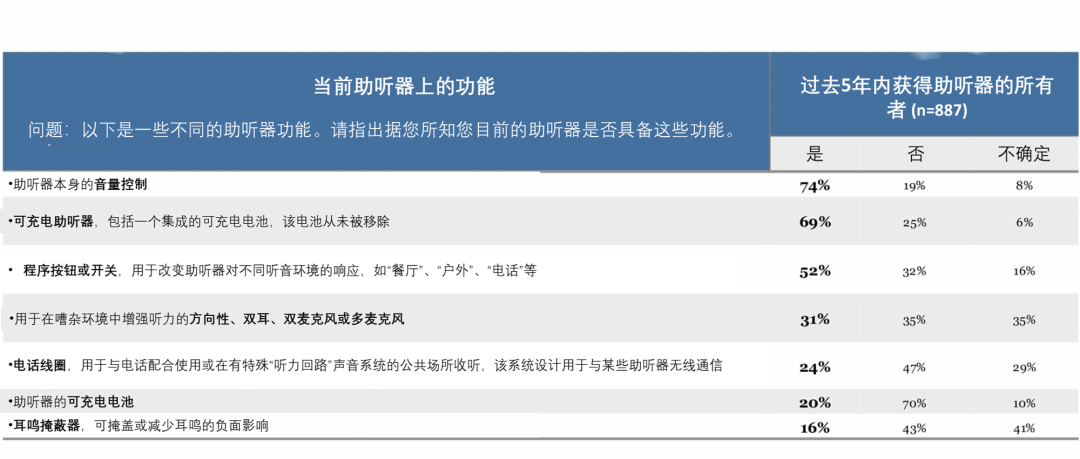
Question: For each listed feature, indicate whether your current hearing aid has it, as far as you know. Sample: owners who obtained hearing aids within the past five years (n = 887). The three columns below are Yes / No / Unsure; all values are percentages.
Volume control on the hearing aid itself: 74 / 19 / 8.
Rechargeable hearing aid with an integrated rechargeable battery that has never been removed: 69 / 25 / 6.
Program button or switch for different listening environments, such as restaurant, outdoors or telephone: 52 / 32 / 16.
Directional, bilateral, dual or multiple microphones to improve hearing in noisy surroundings: 31 / 35 / 35.
Telecoil for telephone use or public venues equipped with a special hearing-loop sound system designed to communicate wirelessly with compatible hearing aids: 24 / 47 / 29.
Rechargeable batteries for the hearing aid (a separate item in the original questionnaire): 20 / 70 / 10.
Tinnitus masker intended to mask or reduce the negative effects of tinnitus: 16 / 43 / 41.
The original percentages are reproduced as shown, including rows that do not total exactly 100%. These are respondents’ reports of features, not independent device tests.
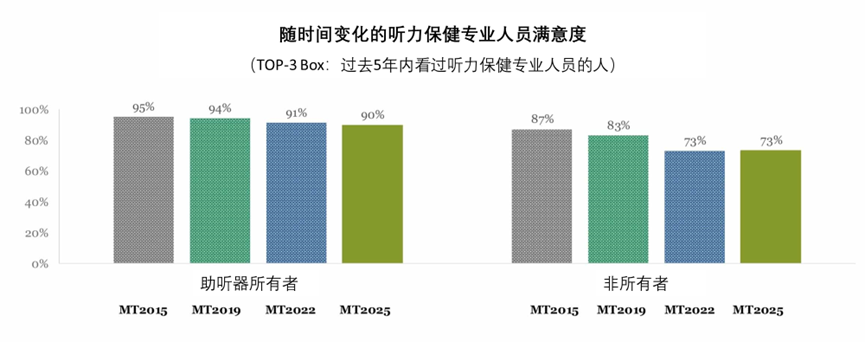
The chart reports the top three satisfaction-response categories (TOP-3 Box) among people who had seen a hearing-care professional within the previous five years. Vertical axis: 0–100%, in 20-percentage-point steps. Each group contains bars for MT2015, MT2019, MT2022 and MT2025, in that order.
Hearing-aid owners: 95%, 94%, 91%, 90%. Non-owners: 87%, 83%, 73%, 73%. The four survey waves are shown in grey, green, blue and olive, respectively.